Dashboard
The home page — live stats, the system events log, and the assistant HUD.
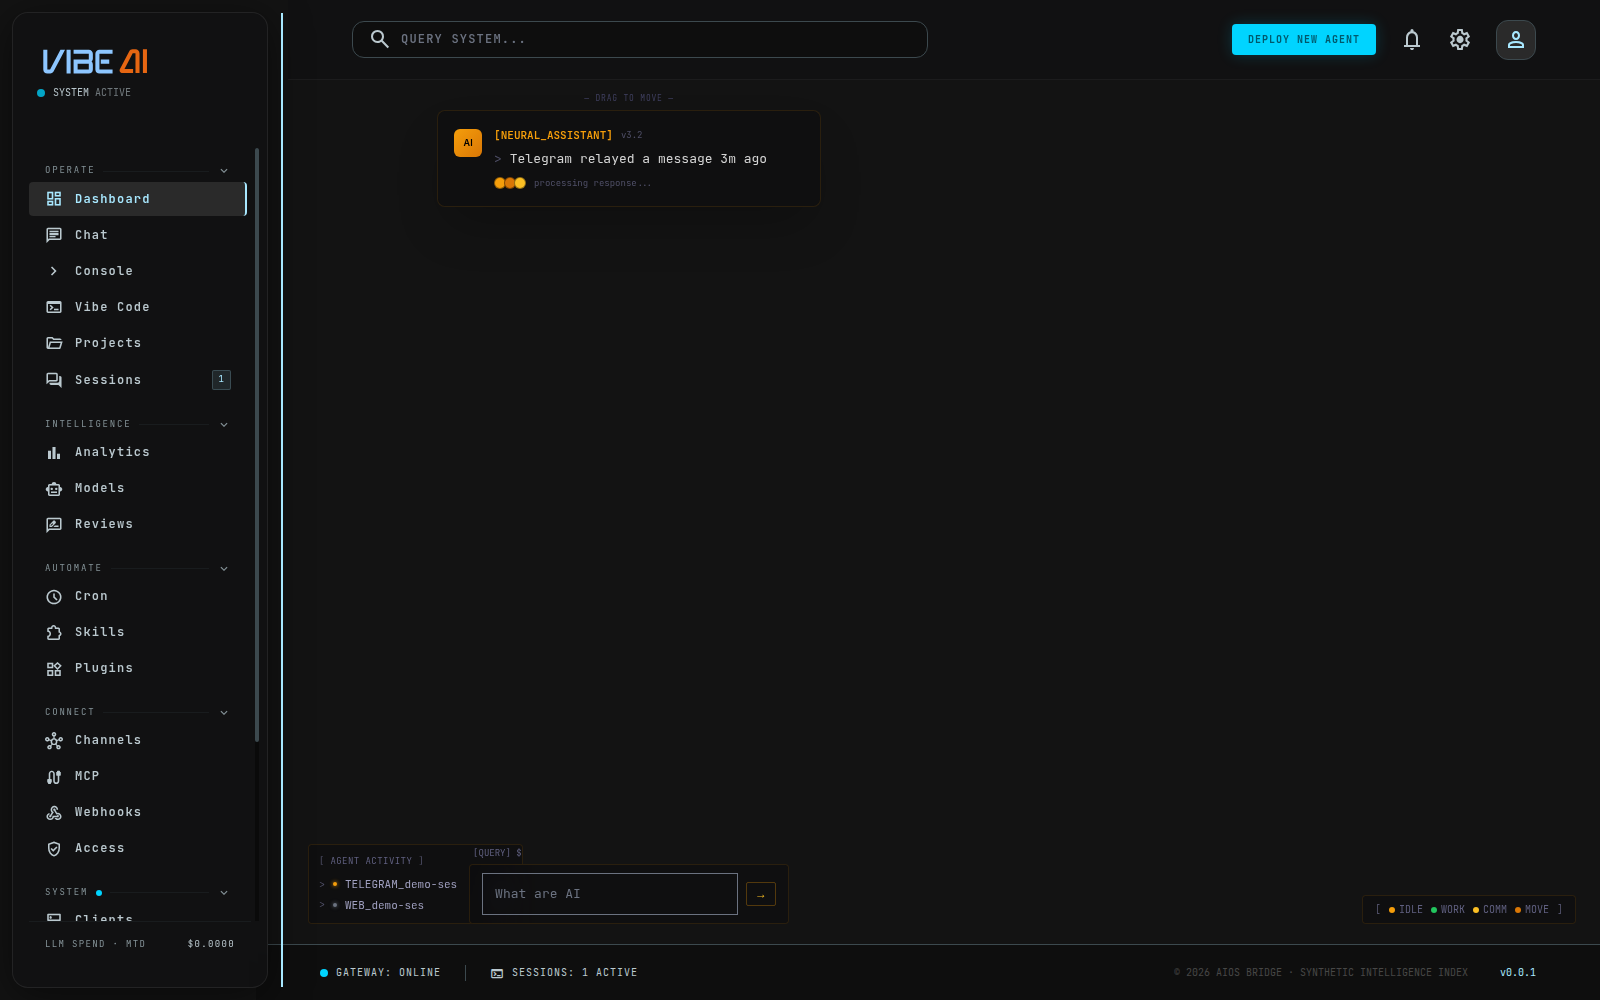
Web UI → Dashboard is the landing page after login. It combines a real-data status strip with a decorative “living scene” overlay — the HUD — whose text content is itself pulled from real sessions, cron jobs, and channels.
Gateway banner
A banner across the top reflects the actual gateway state from /api/status
(backed by systemctl is-active aios-gateway.service, not a state file the
old Python gateway used to write). Offline shows a red accent and a
aios gateway run hint; online shows a green accent and “Gateway Online —
the messaging gateway is live and polling.”
Stat tiles
Four tiles, each backed by a real endpoint:
| Tile | Source | Meaning |
|---|---|---|
| SESSIONS | /api/sessions/stats | total transcripts on record |
| SKILLS | /api/skills | reusable, verified skills installed |
| RUNTIME | /api/model/info | active model tier |
| MESSAGES | /api/sessions/stats | messages across all sessions |
System events log
SYSTEM_EVENTS_LOG lists the 12 most recent sessions from /api/sessions
— timestamp, active/finished status, session id, source, message count, and
model. This is the same data the Sessions page shows in more detail.
Assistant HUD
The free canvas area behind the stat cards renders a 3D scene (a starfield canvas plus an animated sphere) that is purely decorative. Layered over it are glass HUD panels whose content is real:
- Typing bubble (top-center) — types out a rotating feed of real recent
events assembled from
/api/sessions,/api/cron/jobs, and/api/channels(e.g. “session telegram is active — 4 messages so far”, “cron job … last ran ok”). If nothing has happened yet it says so instead of inventing activity. - Agent activity panel (bottom-left) — the 5 most recent sessions with a
live-derived state (
working/idle/waiting/done) computed from how long ago each session was last active. - Three floating cards — anchored to fixed points around the 3D sphere, each round-robins through real session previews (source, message count, model). Dragging a card only moves its visual anchor; it does not change what data it shows.
- Query bar — sends whatever you type straight to the Chat page’s live agent connection, exactly as if you’d typed it there.
The sphere, starfield, and card-line animation are visual chrome with no backing data — only the text inside the HUD panels is fetched from the API. The HUD only appears on the Dashboard page and hides everywhere else.
Sidebar and footer
The sidebar’s “System Active” label and the footer bar poll /api/status
and /api/analytics/usage every ~10-15s: active-session badge next to
Sessions, a gateway health dot on the System section, a spend-vs-budget bar
if a monthly budget is configured, and gateway/session counts in the
footer.